
THE GOLDILOCKS
SYSTEM
Four rules. One zone. Zero guesswork.
A complete rules-based trading system built around one simple truth — quality stocks always return to fair value after institutional moves. The question is knowing exactly when and where to enter.

WHY THE
35%–50%
ZONE
This is not a randomly selected percentage range.
After analyzing every possible pullback zone across thousands of assets and multiple full market cycles, one zone consistently outperformed every other — delivering the highest probability of institutional defense, the least overhead supply from prior buyers, and sufficient depth to generate a meaningful return on recovery.
That zone is 35% to 50%.
Between them is the window where the math, the psychology, and the institutional behavior all align at the same moment.
Below 35% — Too Early
0–35%
The resistance above you is still too heavy. Too much overhead supply from people who bought near the top. The setup does not exist yet.
✓ The Goldilocks Zone
35%–50% — Just Right
35–50%
The math, the psychology, and the institutional behavior all align at the same moment. Highest probability of institutional defense. Sufficient depth for meaningful recovery.
Above 50% — Too Deep
50%+
The damage is usually structural. The momentum that drove the original move is broken. The uptrend cannot be trusted. No entry.
Build. Calculate. Execute.
Build your universe of quality companies. Calculate your zone levels. Set your price alerts. Then let the system work.
No daily screen time required. No chasing momentum. No reacting to noise. Stay disciplined, stay patient, and when your alert fires — execute your pre-written plan.
Your portfolio scales as your universe grows.
Trading is never for the faint of heart. The Goldilocks system was designed to address the emotional pitfalls of human nature — the fear that makes you sell too early, the greed that makes you hold too long, and the impatience that pulls you into setups that were never ready.
The four rules exist to remove those variables. But the system still demands your attention. Update your alerts as new setups emerge. Know your entries before the zone fires. Have your exit plan in place before you enter.
Stay informed about the fundamental quality of your holdings as time progresses. A strong thesis today can shift tomorrow. Earnings surprises, management changes, sector disruption, or significant news events can all change the picture. Know what you own and why you own it — and be willing to act when the original thesis no longer holds.
THIS SYSTEM IS NOT FOR THE PASSIVE INVESTOR.
WORKS WITH WHAT YOU ALREADY HAVE
The Goldilocks system was not built to replace your existing investment strategy. It was built to enhance it.
Whether you are a long term buy and hold investor, a dividend reinvestment strategy follower, a momentum trader, or a fundamentals-first portfolio builder — the Goldilocks Zone works alongside whatever you are already doing.
Think of it as a free layer of opportunity. When any quality company in your existing universe pulls back into the 35%-50% zone — you now have a high-probability entry point to add to a position you already believe in, at the best possible price.
You do not have to change how you invest. You just have to know where the zone is.
THE GOLDILOCKS ZONE
The Goldilocks Zone is the 35% to 50% pullback from a stock's most recent major high — but only when that high was made on significant institutional volume.
Below 35% — Too Early
Too much overhead supply from people who bought near the top. The stock hasn't shaken out enough weak hands yet.
35%–50% — The Goldilocks Zone ✓
Deep enough to clear out weak hands and reduce resistance, but not so deep that the uptrend is destroyed. Not too shallow. Not too deep. Just right.
Above 50% — Too Deep
The momentum that drove the original move is usually broken. The setup no longer qualifies.
THE FOUR RULES — NON-NEGOTIABLE
Rule 01
The High Volume Spike
When a stock makes its most recent major high it must be on at least 2x average daily volume. This confirms real institutional money was behind the move — not retail noise. Without a qualifying volume spike the setup does not exist. No exceptions.
Pull up the daily chart. Compare the volume bar at the recent high to the 20-30 day average. If the spike day shows 2x, 3x, or 4x average — you have a legitimate reference point.
Rule 02
The 35–50% Pullback
Price must be sitting cleanly between 35% and 50% below that high. Use the formula: subtract current price from the high, divide by the high, multiply by 100.
Rule 03
Fundamentally Solid Company
Revenue growing year over year. Long-term debt below market cap. Company operating at least 5 years. Clear competitive advantage.
We are not bottom fishing broken companies. We are buying temporary discounts on fundamentally healthy businesses that were worth owning at their recent high.
Rule 04
Strict Risk Management
The 2% limit exists for one reason — survival. A string of losses on any system is inevitable. The question is whether you survive them. At 2% per trade, you would need to lose 50 consecutive trades to wipe out your portfolio. That has never happened with a properly applied Goldilocks setup on a fundamentally sound company.
The 2% rule is not about limiting your gains — it is about ensuring you are always in the game long enough to collect them
THE LADDER — YOUR PROTECTION
We never put our full position in at once. As price moves deeper into the zone we buy more — at a lower and lower average cost. By the time the stock bounces we are positioned at a better price than traders who chased the first sign of a pullback.
The ladder turns fear into a repeatable process. The deeper it goes the more excited we become — not more nervous. Because we understand the math.
Exit Rule
When the stock bounces to 25% profit — sell half. Lock in real gains. Let the remaining position ride.
Example — $10,000 Allocated
| Rung | Amount |
|---|---|
| Rung 1 — at 37% down | $3,000 |
| Rung 2 — at 43% down | $3,000 |
| Rung 3 — at 48% down | $4,000 |
| Result | Better avg cost than any single entry |
Live in Real Markets
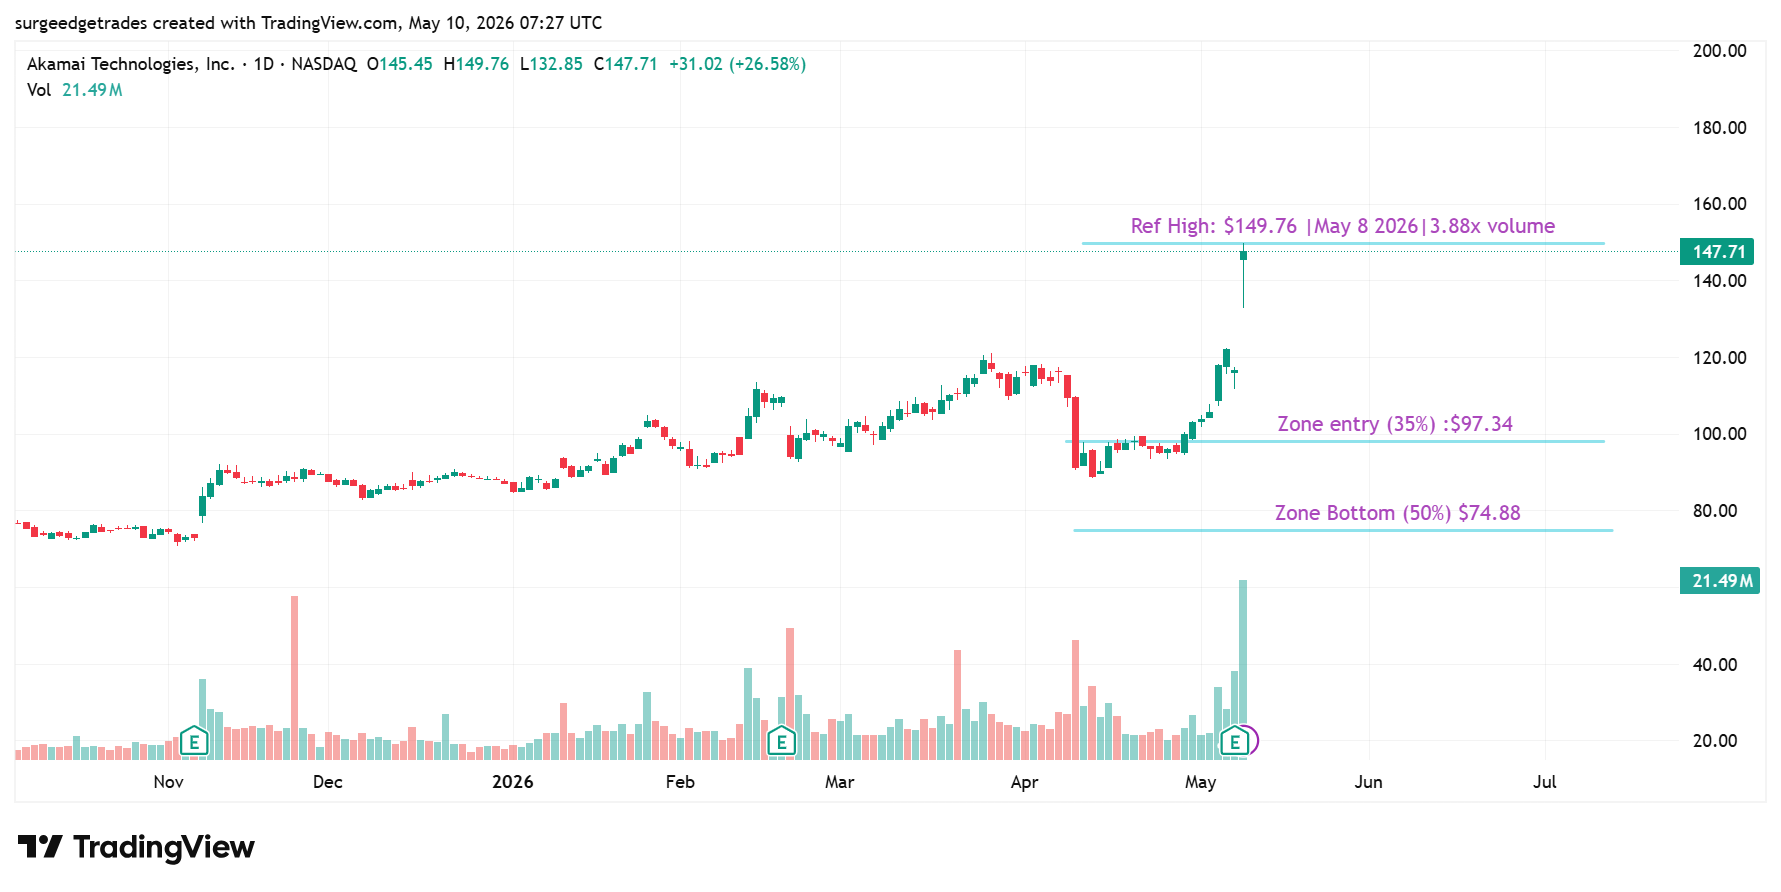
THE SYSTEM IN REAL MARKETS — AKAM
Ticker
AKAM — Akamai Technologies
Sector
Cybersecurity / Cloud Infrastructure
Reference High
$149.76 | May 8 2026
Volume Ratio
3.88x confirmed
Zone Entry (35%)
$97.34
Zone Bottom (50%)
$74.88
Approaching Zone
$101.99
Current Pullback
Near ref high — setup loading
This is not a backtest. This is a live setup documented in real time inside the Surge Edge Intelligence System. Every number logged before the move happens. Alerts set. Watching.
Live in Real Markets
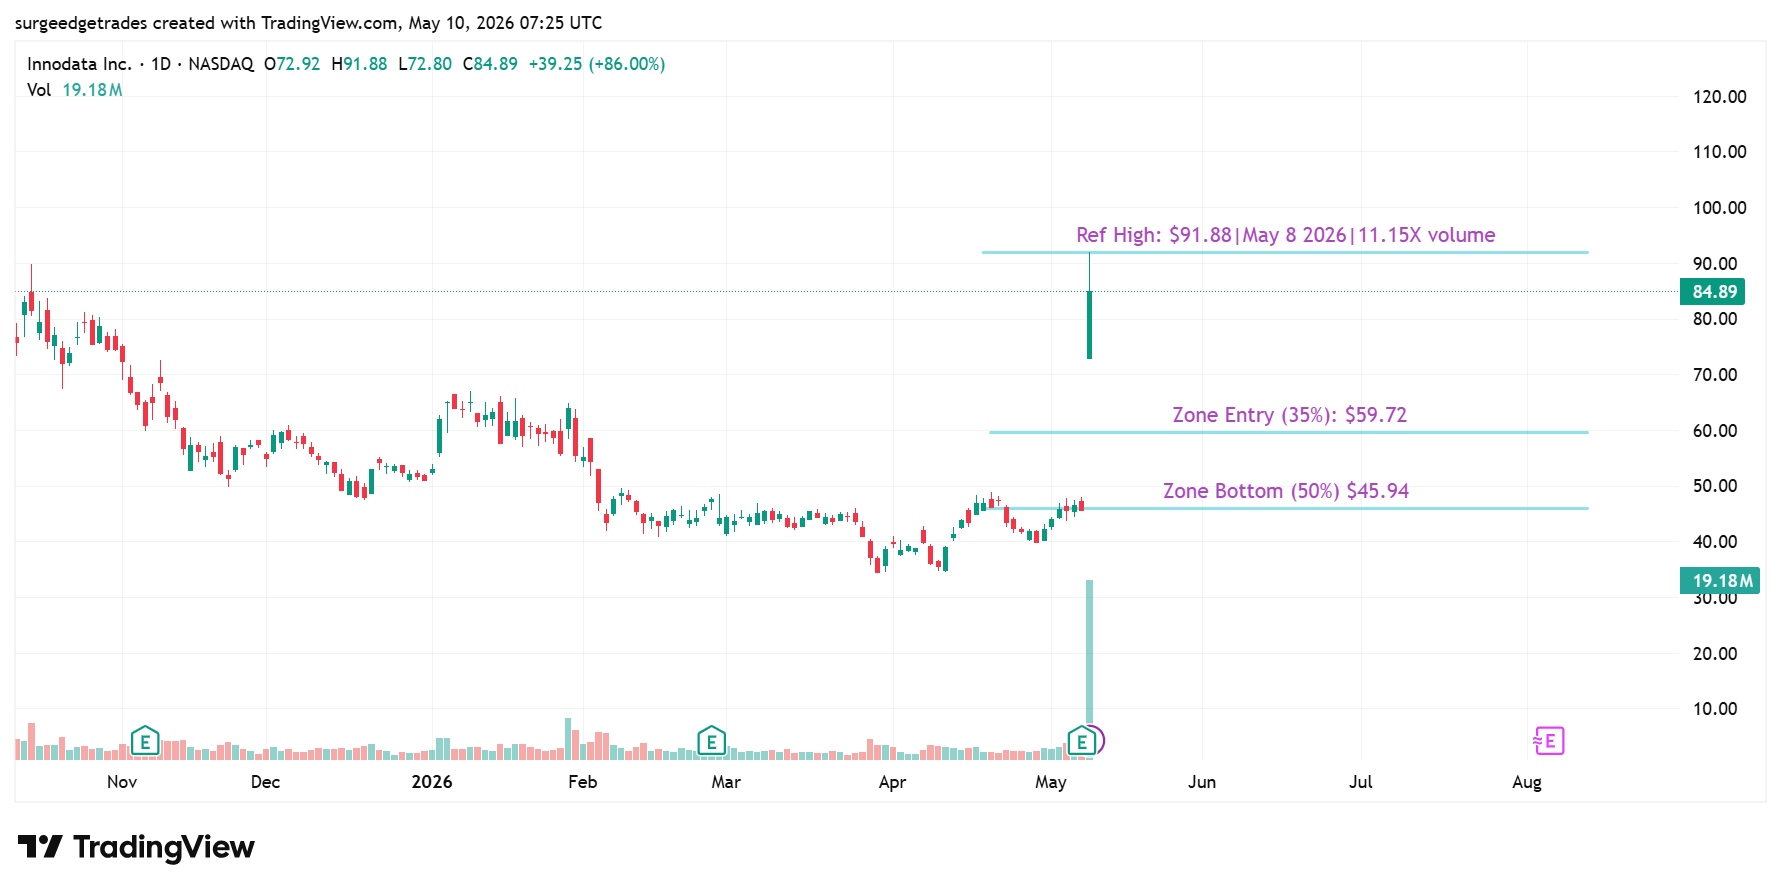
THE SYSTEM IN REAL MARKETS — INOD
Ticker
INOD — Innodata Inc.
Sector
AI Data Engineering / Technology
Reference High
$91.88 | May 8 2026
Volume Ratio
11.15x confirmed
Zone Entry (35%)
$59.72
Zone Bottom (50%)
$45.94
Approaching Zone
$62.48
Current Pullback
$84.89|Pullback 7.6%|Setup developing
This is not a backtest. This is a live setup documented in real time inside the Surge Edge Intelligence System. Every number logged before the move happens. Alerts set. Watching.
GET THE COMPLETE SYSTEM
Everything on this page and more — available now on Amazon.